TTFB is the time to first byte, which is the time it takes the browser to receive the first byte of data from the server in a request.
TTFB is a critical aspect to consider when analyzing a website’s speed. And let’s be honest, it is the leading cause of slow performance for most websites. You can test TTFB using any web resource, such as a webpage, image file, font, or CSS file.
You can measure the response time of your origin server or CDN provider. Moreover, the time to first byte can be tested separately for mobile devices and PCs.
Plus, you’ll get a better user experience if your TTFB is low, since your page will load instantly, assuming everything is okay. But if it is too high, the user will see a blank screen for a short period until the server responds.
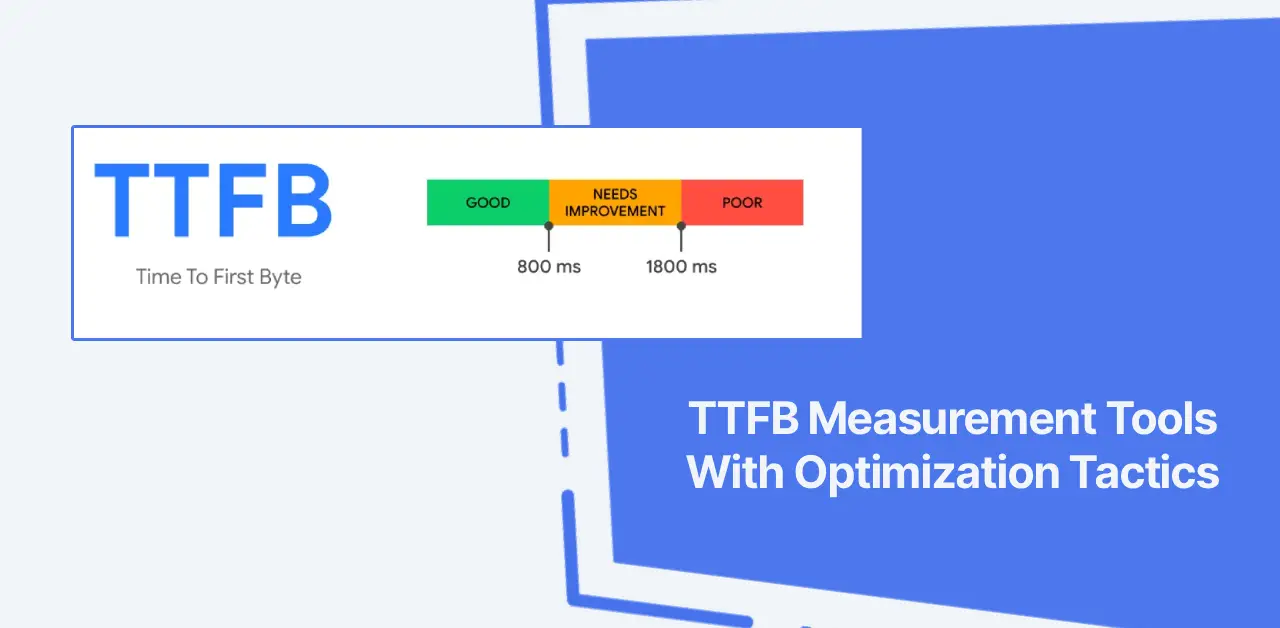
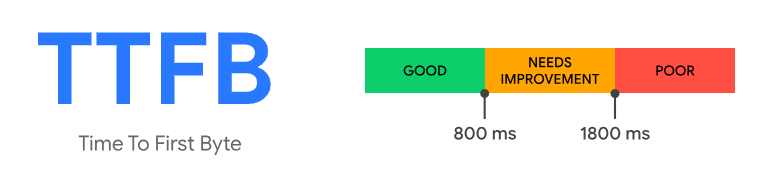
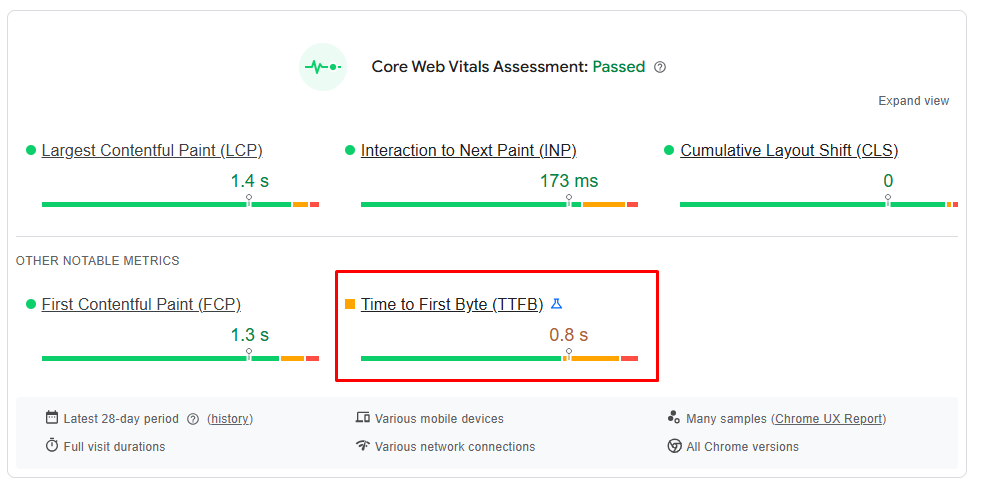
It’s a significant factor in Web Vitals scores. According to Google, good TTFB values are under 0.8 seconds, and negative values are over 1.8 seconds:
A longer distance between your server and visitors results in increased latency and slower TTFB. That’s why professionals recommend CDNs for optimization. It also significantly affects other core web metrics.
TTFB plays a big part in this process, which is why it’s critical. Now, we are going to explore practical tools (websites) for measuring your website’s time-to-first-byte.
KeyCDN Performance Test
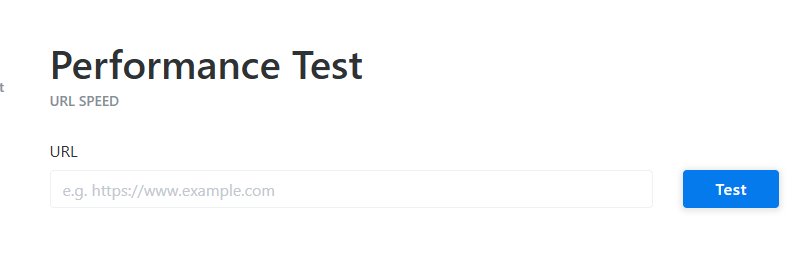
KeyCDN is a famous European CDN provider with over 60 distribution points. It isn’t my favorite, but I like their website performance measurement tools. There are several measurement tools for troubleshooting website, network, and CDN issues.
With “Performance Test,” you can test a website’s time to first byte from 10 different locations around the world. It has a simple UI and allows you to test and measure any URL. You’ll get a breakdown of loading times and HTTP headers in the results.
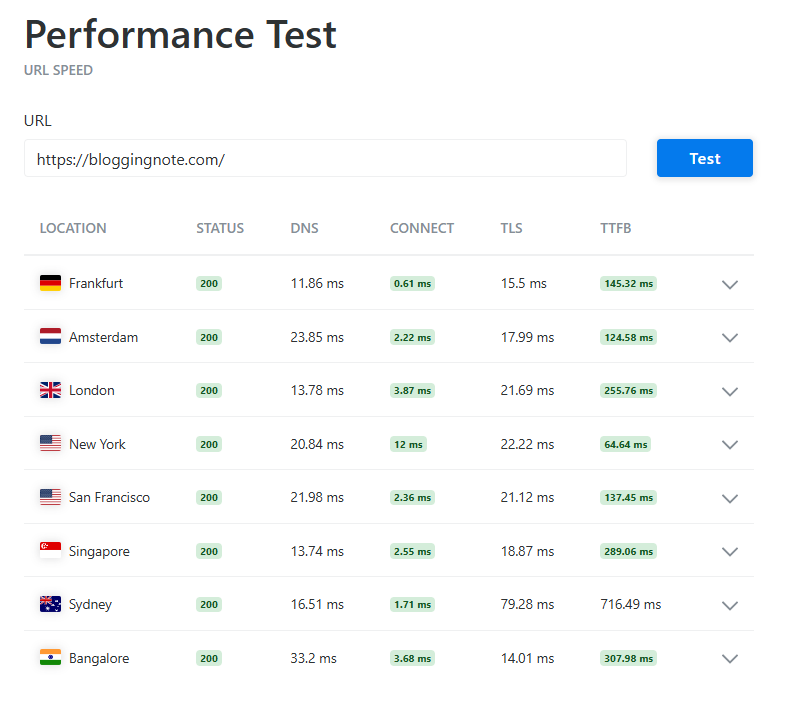
Aside from TTFB, you can also view location, status codes, DNS lookup time, connection time, and TLS overhead.
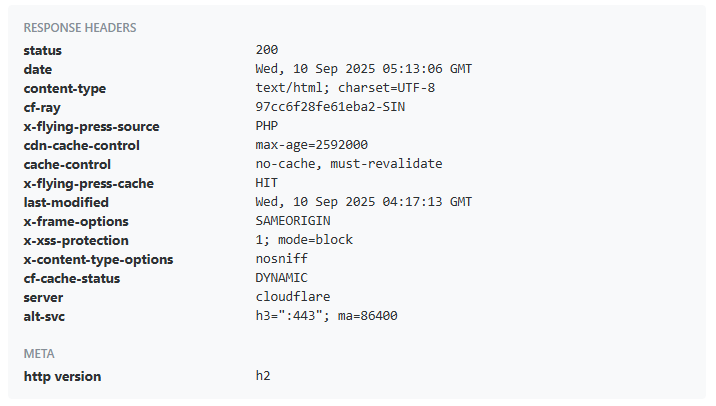
The HTTP response header includes additional metadata such as cache status, CDN details, last-modified date, cache-control, HTTP version, content type, and more.
Flying TTFB
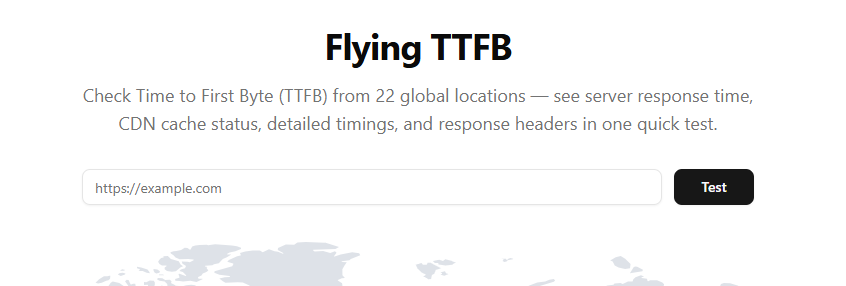
Flying TTFB is a new measurement tool released by FlyingPress (Gijo Varghese). It offers a bit more than KeyCDN, as you can measure across 22 global zones.
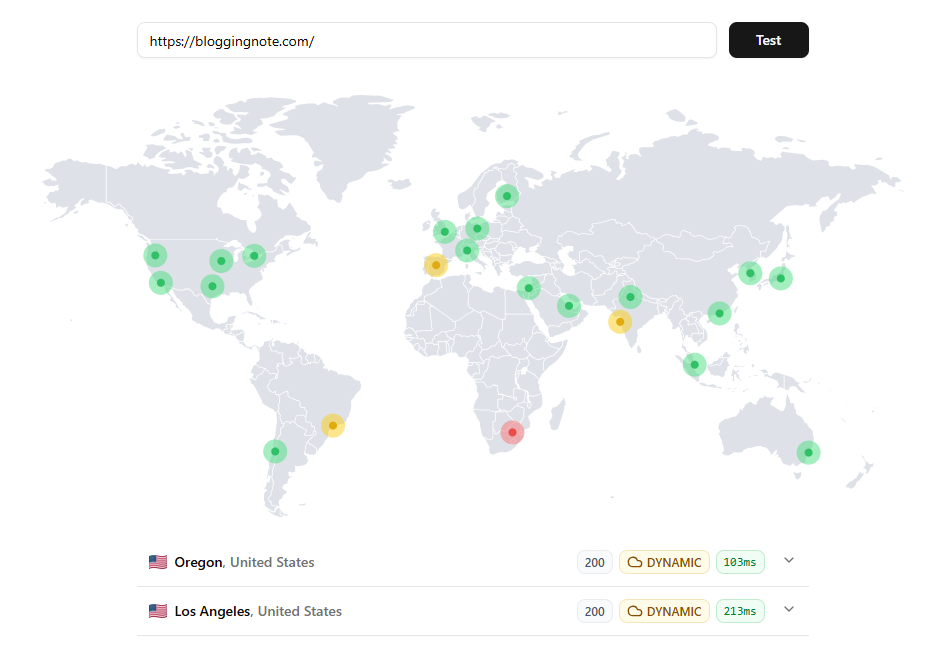
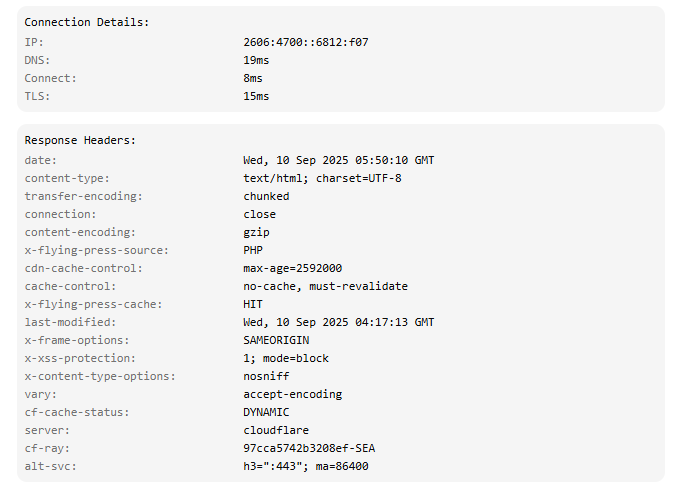
With a quick time-to-first-byte test, you can view server response times, cache status, and header information. You can also view details such as IP address, encoding type (Brotli/Gzip), and cache source.
It is a handy tool for checking your site’s time-to-first-byte, with over 20 locations with HTTP header statistics. It is from the WordPress speed enthusiasts behind the FlyingPress plugin, FlyingCDN, and other Flying plugins. So, you can use it to check how quickly your origin server or CDN responds from locations around the world.
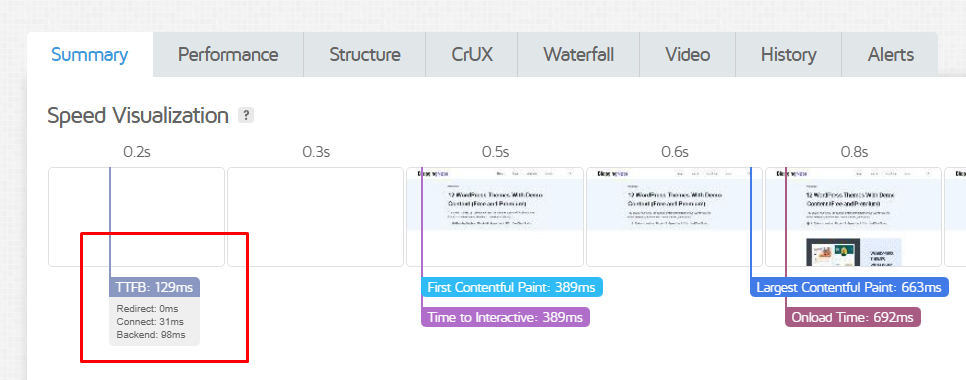
SpeedVitals
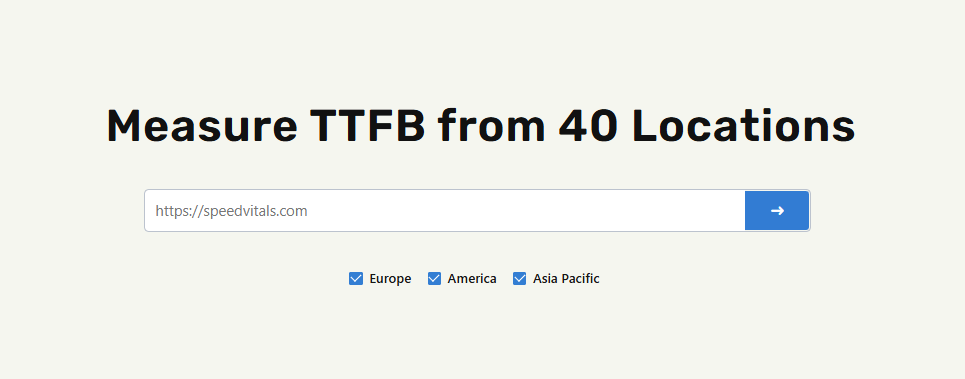
SpeedVitals is a comprehensive website performance test tool, making it more suited to testing multiple locations and details than the previous two options. It is an ideal alternative to GTmetrix or PageSpeed Insights because it lets you test multiple URLs and measure website speed across 40 countries. You can use most of their tools for free, but if you wish to use them at the top level, you must subscribe to their paid plans.
Users can use SpeedVital’s TTFB Testing tool for free across 30 locations. To access all zones, you have to pay. Another benefit is that you can test the time to first byte separately for Europe, the Americas, and the Asia-Pacific. It is top-notch.
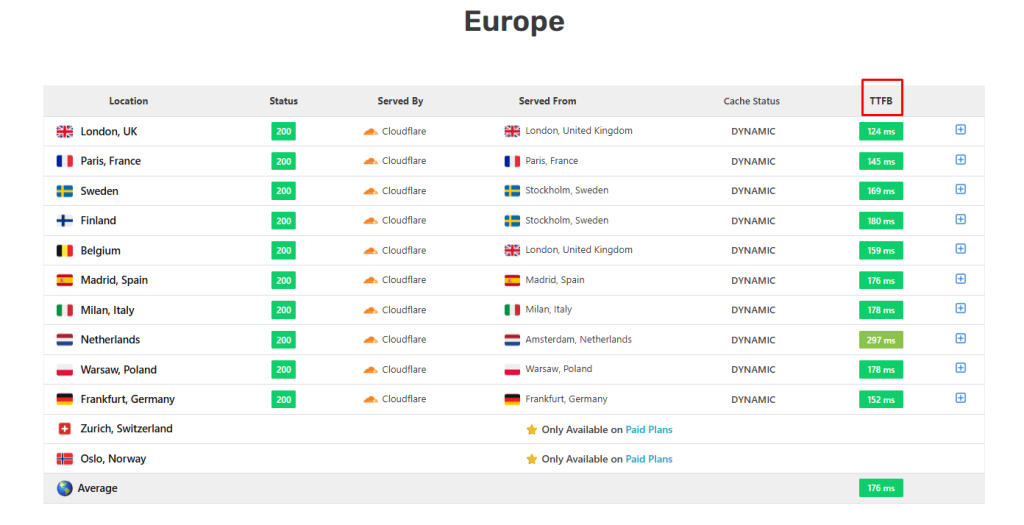
At the end of the results, you can see the measured TTFB values for Europe, the Americas, and Asia-Pacific separately.
Additionally, you’ll see the HTTP header for every location, along with a summary of all locations that includes the average time to the first byte of your site.
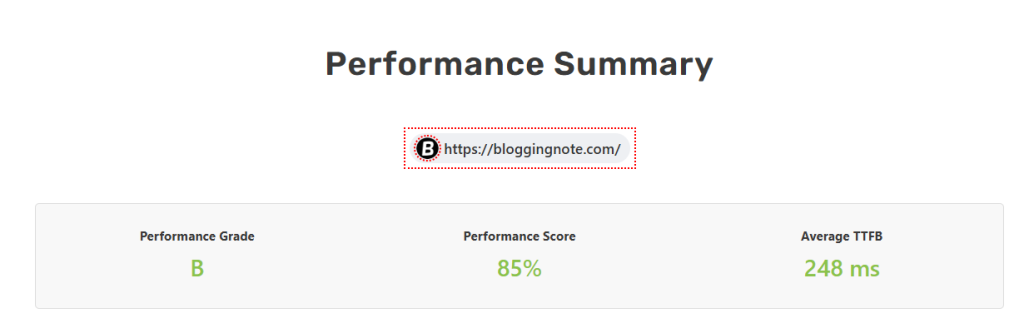
SpeedVitals isn’t just a measurement tool; it’s a comprehensive package for those who care about website speed and other key optimization factors.
It’s one of my favorites as a WordPress speed enthusiast. They provide helpful tutorials focused on optimizing website performance.
I also suggest running the test at least two times to get more reliable results. It helps ensure the resource is cached and delivered from the CDN’s nearest data center.
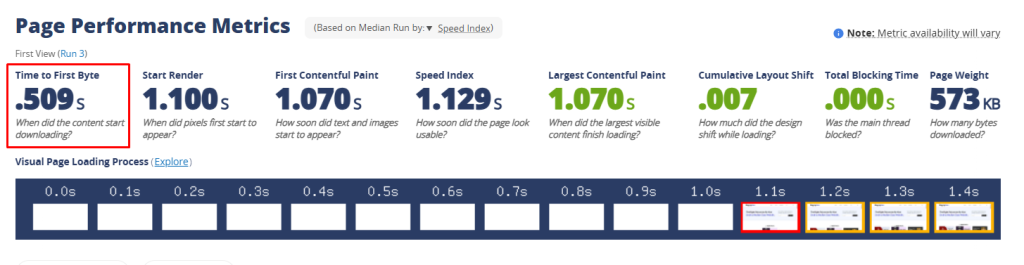
GTMetrix
GTmetrix is one of the most popular tools for testing and monitoring webpage performance. It is an all-in-one tool for measuring pages across multiple levels.
GTmetrix was a free tool with plenty of features, but now you must create a free account to use it effectively, and it limits you to 5 tests per day. To test your web pages globally, you’ll need a paid plan.
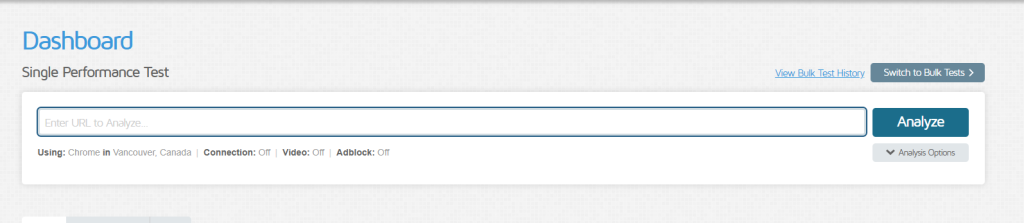
Still, the free account lets you test web pages in 10 different areas, and the paid account allows you to test web pages in 25 different locations worldwide. When using GTmetrix to examine your first-byte time, test the URL to see it in the results.
GTmetrix results provide a detailed overview of your website’s performance. On a page, you can view the total loading time for each site asset type.
I like the waterfall chart because it helps us identify the causes of site slowdowns. It’s still a valuable tool for web owners/devs.
WebPageTest
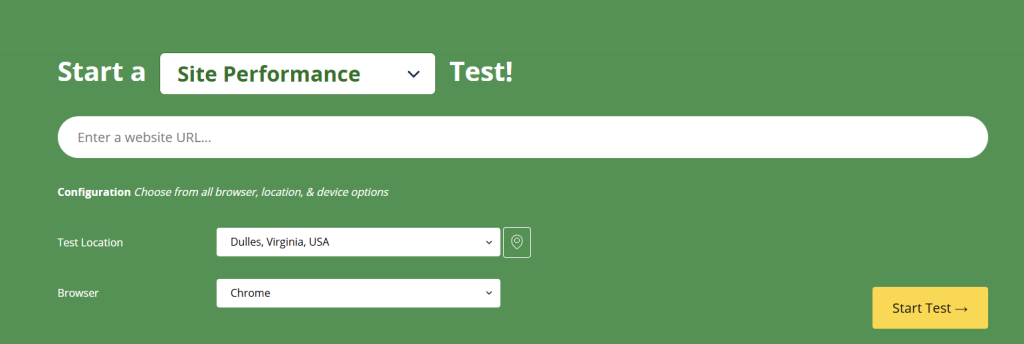
WebPageTest provides an in-depth look at your website’s performance. Even the free account allows you to analyze data from over 20 locations.
It’s a modern tool for anyone seeking configuration options for browsers, locations, and devices. You can set the connection speed and the browser dimensions.
When you test your URL, its performance overview provides a detailed breakdown. It’s not just about the first byte; you can see the optimization summary for each asset on the website. Beyond that, you can view the technologies used to build your website, including WordPress, PHP, themes, plugins, and CDN.
WebPageTest is one of the most comprehensive tools for measuring webpages. There are more details about your site than just performance stats.
PageSpeed Insights
PageSpeed Insights is a widely used website performance audit tool that analyzes how well a site performs and is often abbreviated as PSI.
It is an entirely free tool provided by Google for developers. It is a comprehensive tool for analyzing websites separately on desktop and mobile devices. Compared with GTmetrix and WebPageTest, it’s less complex, but you can still learn a lot about your site. You can view the Web Vitals Assessment on both desktop and mobile devices.
PSI gives you an idea of your site’s performance, TTFB, to real browsers. So those are the measurement tools that check the time to the first byte of your website. They’re usually comprehensive, not just statistical ones. Now let’s talk about optimization.
Optimize TTFB With These Tactics
Concentrate on keeping TTFB low in the regions where most of your website visitors are located. For instance, if most of your website visitors are in North America, prioritize optimizing time-to-first-byte for that region.
But if your audience is global, aim to keep the time to first byte low everywhere. And here are some optimization tactics you can implement on your own:
- Web Hosting: When your hosting is poor, no matter how many optimization techniques you implement. A good host is the first step to optimizing TTFB. Typically, a decent VPS can handle most types of websites, so consider Vultr, UpCloud, DigitalOcean, or any other reputable VPS provider. Or you can use a modern host such as Rocket.net, Servebolt, or Rapyd.cloud.
- Modernize Your Server Applications: Keep Them Up to Date. Ensure you’re running the latest versions of PHP, Redis, LiteSpeed/Nginx, MariaDB, and any other required components.
- CDN: A CDN helps websites handle global traffic, improving performance for users worldwide. However, it’s not always accurate, as even with a CDN, you likely wouldn’t notice any improvement. This is because you’re using it without any optimization features. Many CDNs, such as Cloudflare, BunnyCDN, Fastly, and others, offer tools to accelerate webpages for global users.
- Cloudflare: IMO, Cloudflare is the most reliable CDN and security solution. Cloudflare makes it easy to optimize TTFB with APO and Argo Smart Routing, reducing first-byte latency to an average of under 100ms.
- Edge caching (dynamic): Dynamic caching is typically enabled by default in modern CDNs. Caching HTML can cut TTFB in half. When you use a reliable CDN with dynamic caching, you can achieve a TTFB of under 200 ms.
- Caching: Most CMSs and web servers support multiple cache levels. You can significantly optimize your website using caching plugins such as FlyingPress, LiteSpeed Cache, or WP Rocket on CMS platforms like WordPress. Modern hosting services utilize server-side caching mechanisms.
And finally,
You can test your webpage’s time-to-first-byte using the KeyCDN Test, Flying TTFB, DebugBear, and SpeedVitals. Your goal is to keep your website’s average global response time under 400 milliseconds. You can try tools like WebPageTest or GTmetrix if you want a more in-depth look at your website’s performance.
Read more: Spaceship VPS Overview | Webdock Cloud VPS Review